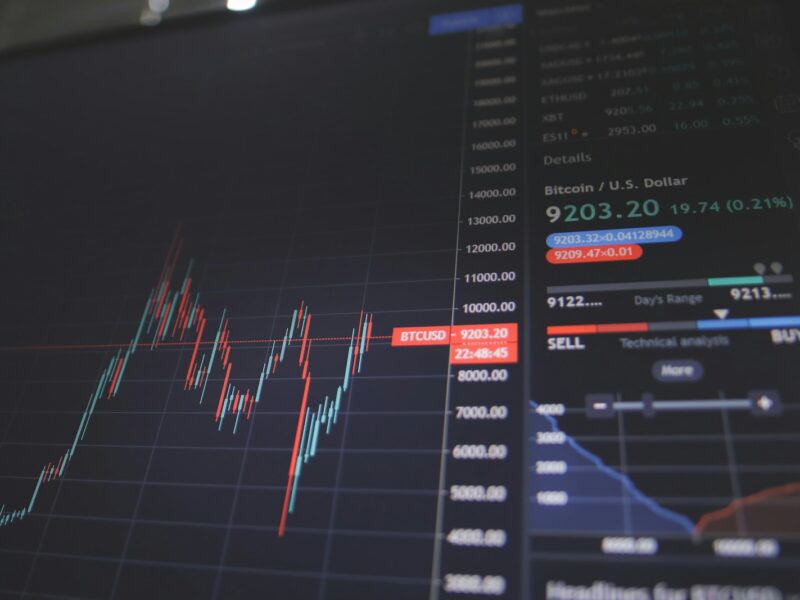
Fibonacci retracement in forex identifies key levels of support and resistance. Fibonacci levels are commonly calculated after a market has made a significant move either up or down and seems to have flattened out at a certain price level.
Traders plot the key Fibonacci retracement levels of 38.2%, 50%, and 61.8% by drawing horizontal lines across a chart at those price levels to identify areas where the market may retrace before resuming the overall trend formed by the initial hefty price move.
By drawing these lines across areas of known past support or resistance, you get defined dynamic areas where future market participants could come in and supply or take away from the current momentum.
To implement Fibonacci ratios, draw a line from one extreme low to another extreme high so that it creates a top angle as well as a bottom angle – this is your first Fibonacci ratio. Then, draw two more angles above and below the first line to create your second and third angles.
Draw a horizontal line across each of these points and add in as many levels as you would like, but be sure to remove irrelevant lines that may not have any significance on long-term trends. These lines should act as dynamic support and resistance areas within the market.
Remember: Fibonacci retracements are not predictive. They show what could happen at a certain level and do not predict where prices will go. It is up to the trader to decide if they want to take action on those levels based on their research and analysis.
Fibonacci levels are considered especially important when a market has approached or reached significant price support or resistance level.
The 50% level is not part of the Fibonacci number sequence. Still, it is included due to the vast experience in trading of a market, retracing about half a significant move before resuming and continuing its trend.
Forex Strategies by Traders Using Fibonacci Levels
Each trader’s strategy will be different, so as an investor, you need to consider how each of the strategies below might fit into your overall angle on the market. Not every trader uses the options below, and it is alright if none of them aligns with your strategy. Strategies that utilize Fibonacci retracements in forex include the following:
- You can buy near the 38.2 percent retracement level with a stop-loss order placed a little below the 50 per cent level.
- You can buy near the 50 percent level with a stop-loss order placed a little below the 61.8 percent level.
- When entering a sell position near the top of the significant move, you can use the Fibonacci retracement levels as profit-taking targets.
- If the market retraces close to one of the Fibonacci levels and then resumes its last move, you can use the higher Fibonacci levels of 161.8 per cent and 261.8 per cent to identify possible future support and resistance levels if the market moves beyond the high/low you reached that before the retracement.
- Fibonacci Retracement levels are based on past swings in price, so it is vital to determine which swings are the most relevant to your market and which ones may not have as much significance
- Keep in mind that these levels can also be used to trace out potential supply and demand zones, as well as display areas where a reversal is likely
- To maximize their effectiveness, it is essential to combine them with other forms of analysis such as momentum indicators or Bollinger bands if possible. If they are applied correctly, then Fibonacci can certainly help traders find meaningful areas within a market where price could potentially reverse.
Trading Style
Almost all traders have a trading style or set of strategies they utilize to maximize profit potential and keep their emotions in check. The Fibonacci trading strategy utilizes complex data, and if a trader adheres to their strategy, there should be minimal emotional interference.
The Fibonacci trading strategies discussed above can be applied to long-term and short-term trades, anything from mere minutes to years. However, due to currency changes, most trades are executed on a shorter time horizon.


