Calculating the standard deviation is a critical part of the quantitative methods section of the CFA exam. Because of the time constraints, it is very important to quickly calculate the answer and move on to the next problem.
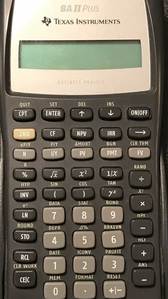
The fastest way to get the right answer is to use the Texas Instrument BA II Plus calculator to compute the answer for you.
This article will cover the basic information you need to know to understand the standard deviation formula and how to interpret the results.
It will also give you a step by step process for quickly calculating the right answer using the BA II plus calculator.
- $5 Referral Bonus: Sign up for Acorns today!
What is the Standard Deviation Formula?
The standard deviation formula is the square root of the variance. The variance is calculated as the average squared deviation of each number from its mean.
The standard deviation and the variance represent statistical measures used to calculate the dispersion or variability around a central tendency.
In the context of the CFA exam, standard deviation and variance are typically utilized to measure the variability of risk and return for investments.
In this context it is also important to draw a distinction between population variance and sample variance as well as between population standard deviation and sample standard deviation.
- Compare the Best CFA exam prep course options.
Population Standard Deviation
Population standard deviation simply represents the square root of the population variance. The population variance represents the sum of the squared deviations of an entire population from the population mean.
See below for the population standard deviation formula:
- σ = √(∑ (X – µ)² / N
“X” represents each unit within the total population and “µ” represents the population mean. “N” represents the total number of units within a population.
Sample Standard Deviation
The sample standard deviation is calculated in the same manner as the population standard deviation except that the denominator includes “N-1” and the numerator measures the squared differences between the sample mean instead of the population mean.
The sample standard deviation formula is highlighted below:
- σ = √(∑ (X – X‚)² / (N – 1)
“X‚” represents the sample mean of the population.
Sample Standard Deviation Example
The 10 year annualized total returns for 5 portfolio managers is: 30%, 12%, 25%, 20%, and 23%. Calculate the standard deviation for the sample.
- The first step is to calculate the mean of the sample which is 22%.
- The second step is to calculate the sample variance which is 44.5%.
- The final step is to calculate the sample standard deviation which is 6.67%.
Sample Standard Deviation Interpretation
The sample standard deviation measures the dispersion of the sample population around the mean value.
In a normal distribution, about 68% of the population will fall within 1 standard deviation of the mean and 95% of the population will fall between 2 standard deviations of the mean.
Can the Standard Deviation be Negative?
The standard deviation value can not be a negative number.
The reason for this is that the standard deviation is a measure of distance or dispersion around a mean value. Distance is never a negative value.
Calculating the Standard Deviation Using the BA II Plus Calculator

The BA II plus is one of the only two approved calculators for the CFA exam. Calculating the standard deviation on a calculator will save you a significant amount of time on exam day.
The best way to learn how to use the calculator function is by trying a sample question.
Sample Question
This will be the same problem as before with the 5 portfolio managers that have the following returns: 30%, 12%, 25%, 20%, and 23%. Calculate the sample standard deviation.
- Step 1: press “2nd” then “7”. This activates the data screen.
- Step 2: press “2nd” then “CE/C” to clear all your existing work.
- Step 3: enter the first return “30” into the first “X01” screen and press enter.
- Step 4: hit the down arrow button “↓” and scroll past “Y01” and hit “↓” one more time until you get to “X02”.
- Step 5: input the next return value which would be “12” and hit enter. Follow this process until you input all 5 values.
- Step 6: press “2nd” then “8” which is the “STAT” screen.
- Step 7: press “2nd” then “enter” which is the “SET” screen. Keep hitting the “2nd” and “enter” button until you see “1-V”.
- Step 8: press “↓” to scroll through the calculated statistics. You will hit the “↓” button 3 times before you reach the standard deviation screen which will start with “Sx” and should equal “6.671”.
How to Interpret the Statistics Screens
After you reach the statistics screen, you will scroll through three results. See below for how to interpret the results:
- “N = 5”. This represents the number of the values in your sample. We had 5 portfolio managers so this is correct.
- “X = 22”. This is the mean for your population. In other words it is the average of 5 portfolio manager returns (30%, 12%, 25%, 20%, and 23%).
- “Sx = 6.671”. This is the standard deviation for your sample and represents the answer to the original question.
Scratch Paper vs Calculator
There is no question that using the BA II plus will make your life so much easier on exam day.
The most important thing you can do to prepare is to practice CFA sample questions using your calculator. At first it might it might seem slow, but the more you practice with the calculator, the faster you will get.
Using scratch paper to complete a standard deviation problem will take you double or triple the amount of time it will take to answer using your calculator.
When you add up the time savings, it can make a really big difference.


